Scores show little improvement; little progress in closing achievement gap
The Minnesota Department of Education released the results of the 2015 Minnesota Comprehensive Assessments (MCA) early morning on Thursday, July 30. These yearly tests, required by state and federal law, are one tool schools use to help measure students’ progress in meeting expectations in reaching Minnesota state standards in the areas of reading, math and science.
Statewide districts experienced mixed results without any dramatic increases or decreases in proficiency from 2014.
In reading statewide, nearly 60% of students mastered state standards, compared with 59% in 2014. In math, 60% of students met math standards, down from nearly 62% in 2014.
There was also little progress in closing the state’s persistent achievement gap between white and minority students. White students continued to outperform students of color by more than 20 percentage points on average.
Find your child’s individual school on the http://rc.education.state.mn.us/
This Minnesota Report Card gives easy access to understandable district and school data. The website provides easy access for parents, educators, schools, districts and citizens and to district and school information, test results, revenue and expenditure data, demographic information and other critical data – all in one spot. Available on the left side of the page is a menu of reports from which to select to learn more about the state of education in your local district, a specific school – or the state as a whole.
Included on the menu are:
* My School – Demographics, trend data, graduation rates, contact information and more, providing a “snapshot” of any district of school in Minnesota.
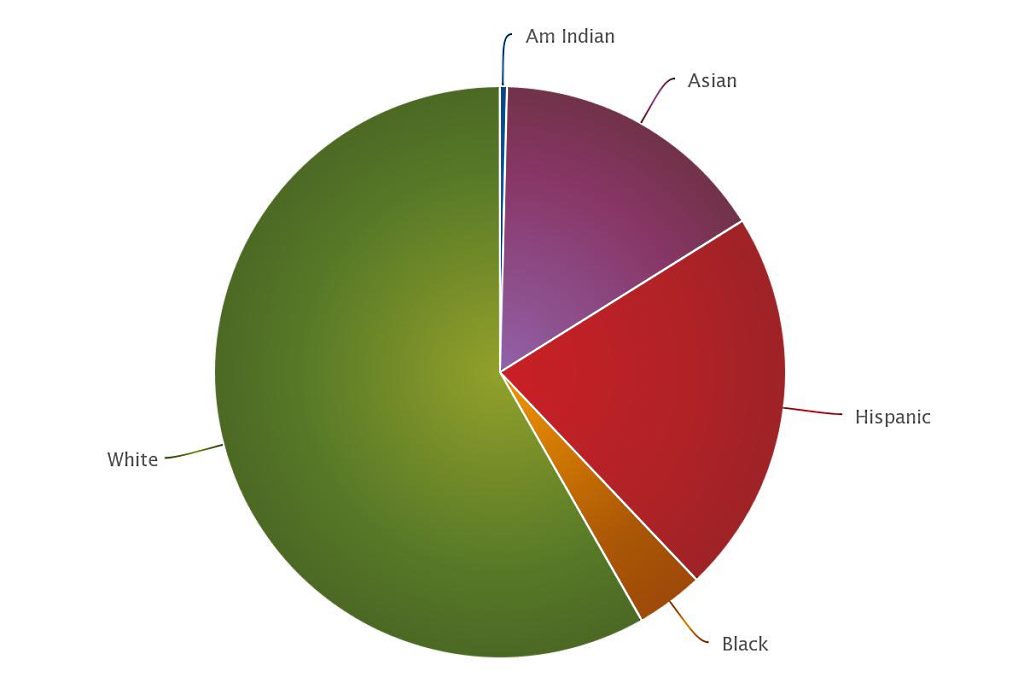
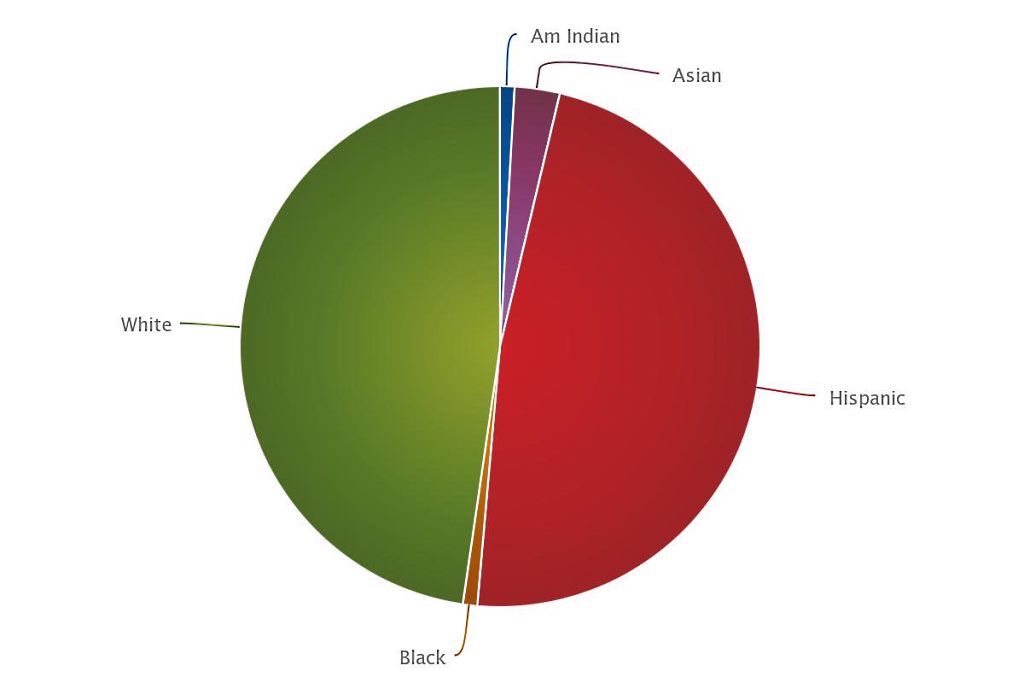
* Demographics – Student population by ethnicity and special populations.
* Test Results – Data by school or district, test type, subject, testing year, grade level, race/ethnicity, gender and more; five-year trend data.
* Graduation Rates – Select up to four student groups at once to narrow results; choose four-, five- or six-year graduation cohort rates.
* School Performance – The four components of the Multiple Measurement Rating (MMR) and the Focus Rating (FR), including proficiency, growth, achievement-gap reduction and graduation.
* Student Progress – Growth students have made in the previous five years.
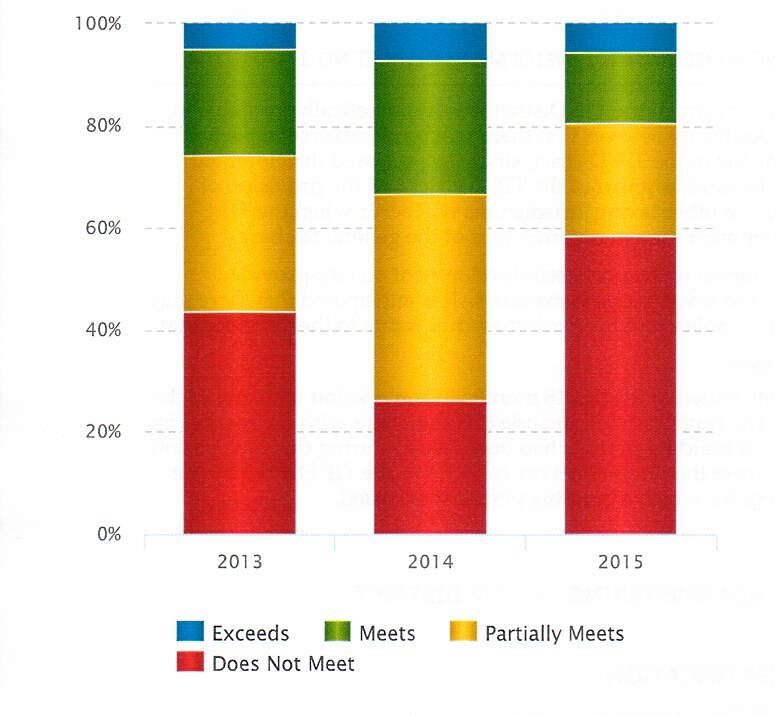
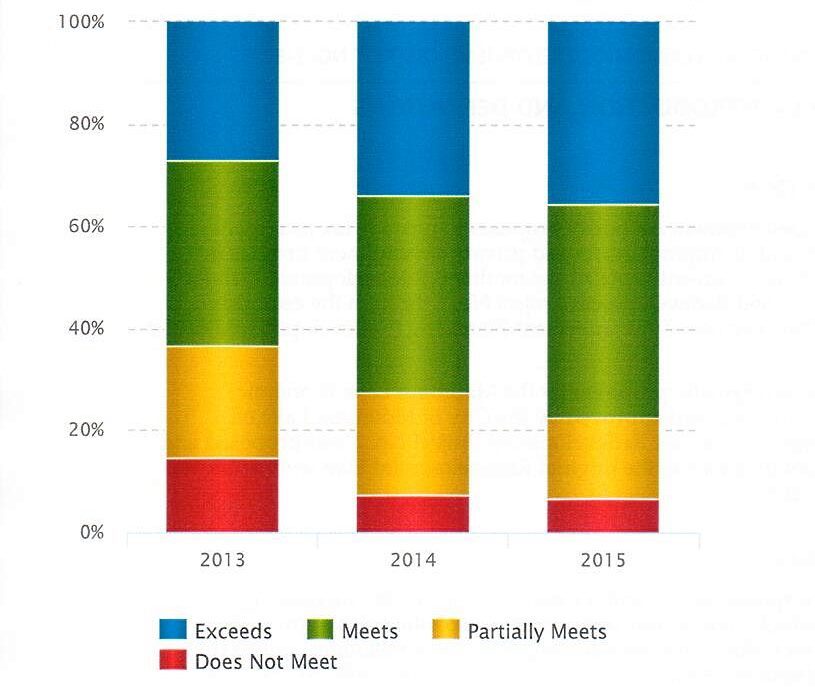
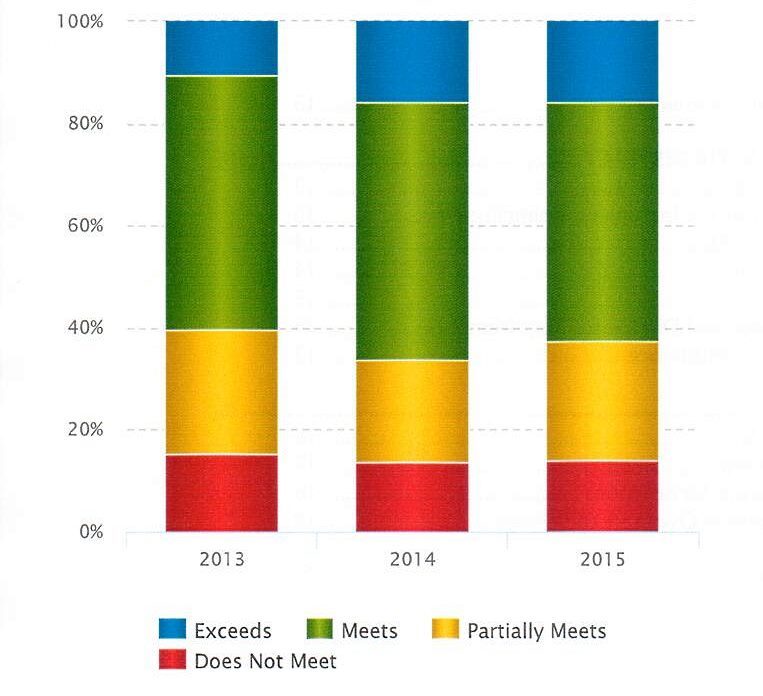
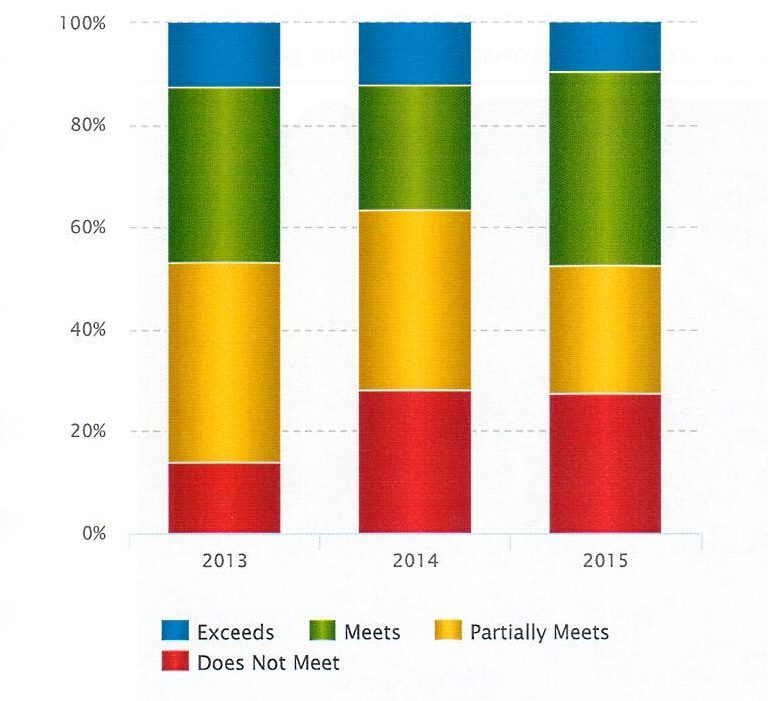
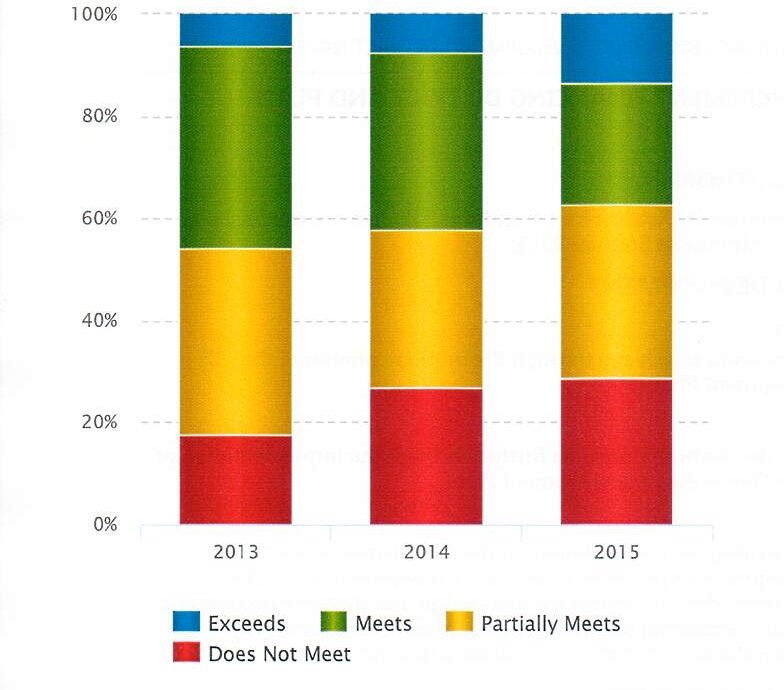
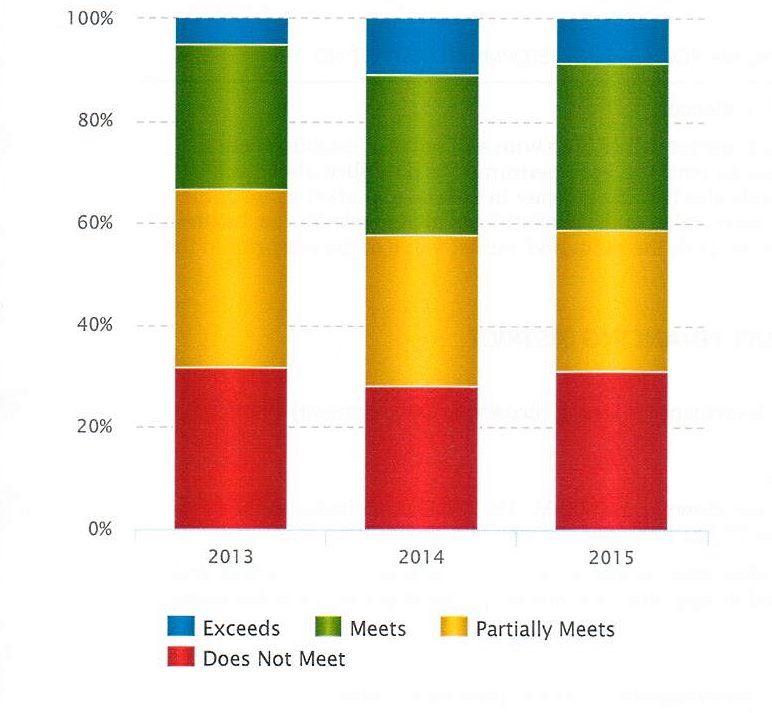
* Academic Standards – How well students did on statewide exams according to four levels of achievement. (Exceeds, Meets, Partially Meets and Does Not Meet.)
* Staffing Profile – Full-time equivalents (FTEs) for teachers, paraprofessionals, administrators and more; average salaries, experience and education levels and student/teacher ratios.
* Federal Accountability – History of a school’s – or a district’s – Adequate Yearly Progress (AYP) designations, broken down by subject, participation and proficiency, along with graduation and attendance.
* NAEP – NAEP (the Nation’s Report Cart) is the only nationally-representative assessment of what America’s students know and can do. It is the only assessment that can be compared across states. Assessments are conducted every two years in Math and Reading producing state results.
* Engagement And Safety – Minnesota Student Survey results related to students’ educational engagement, connections at school and school safety.
* College-Going – This report shows the number of Minnesota public high school graduates who enroll in post-secondary education and how many have successfully completed 30 or more semester credits in the first 16 months.
The Minnesota Comprehensive Assessments – Series II (MCA-II) are the state tests measuring student progress for districts to meet the No Child Left Behind (NCLB) requirements. Mathematics are given in grades 3-8 and 11. Reading is assessed in grades 3-8 and science is given in grades 5 and 8.
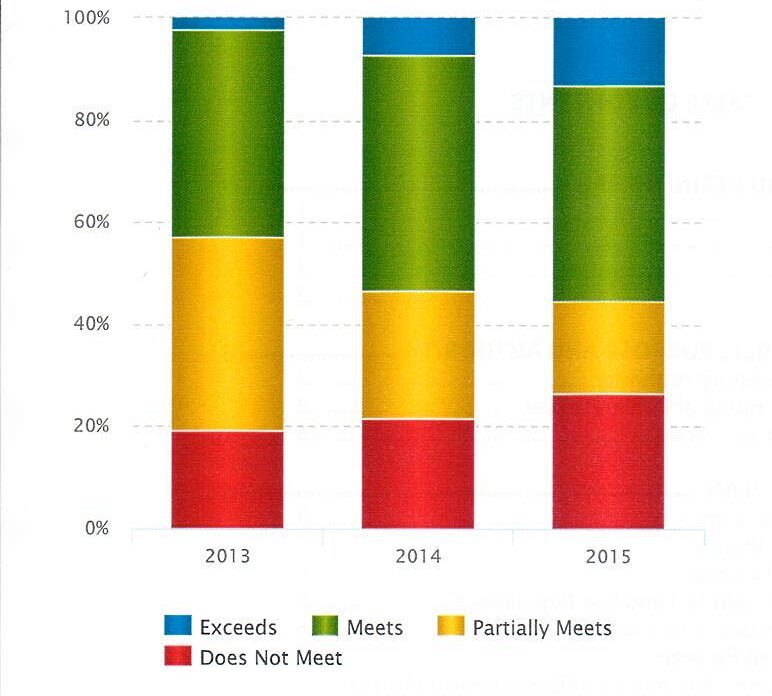
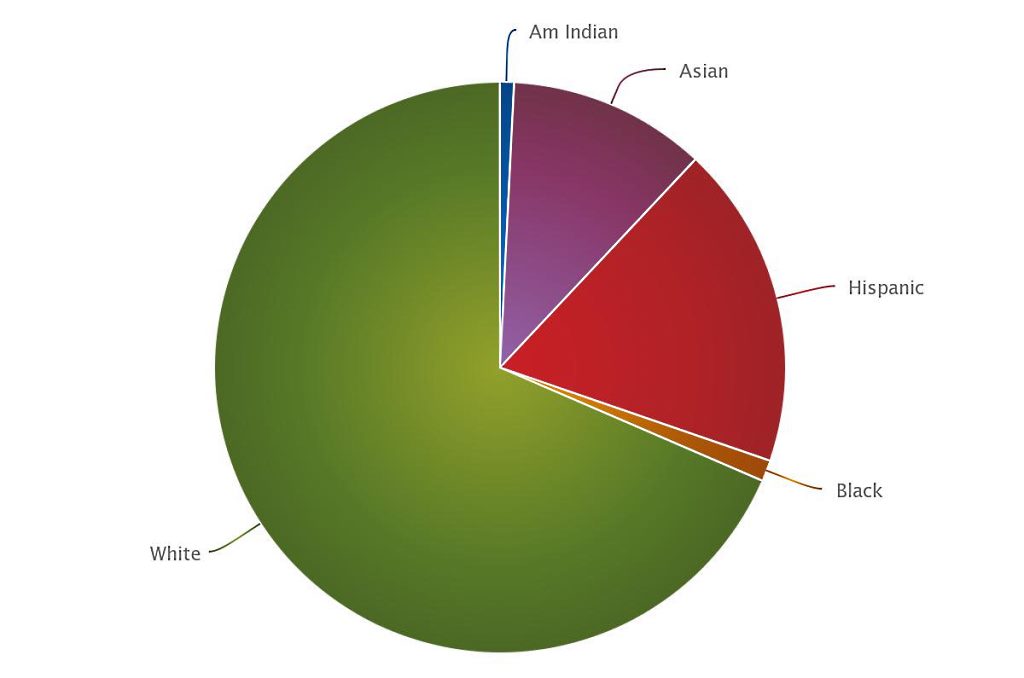
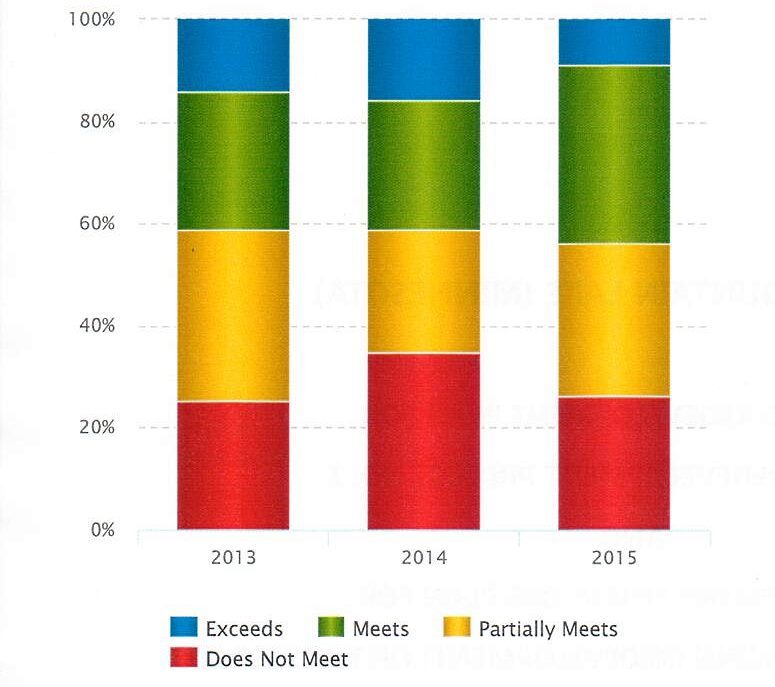
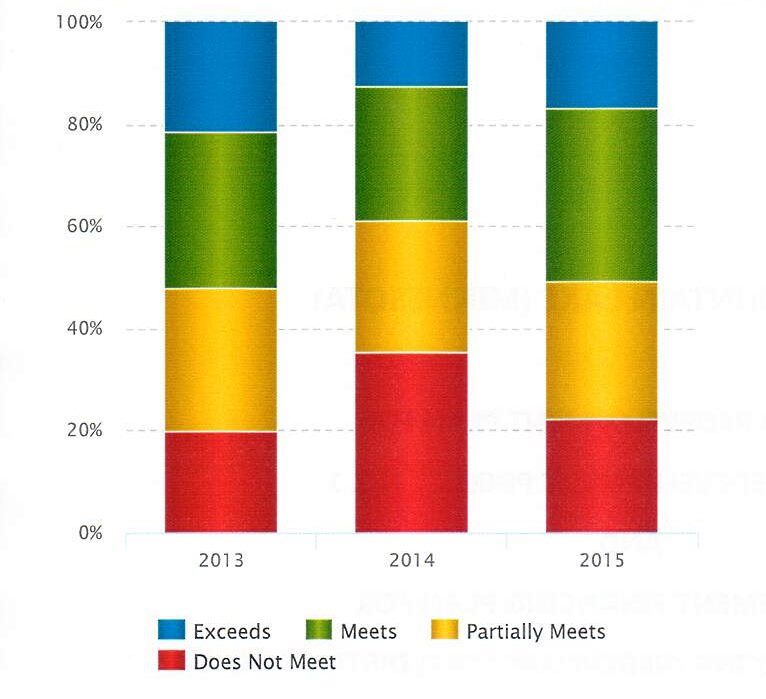
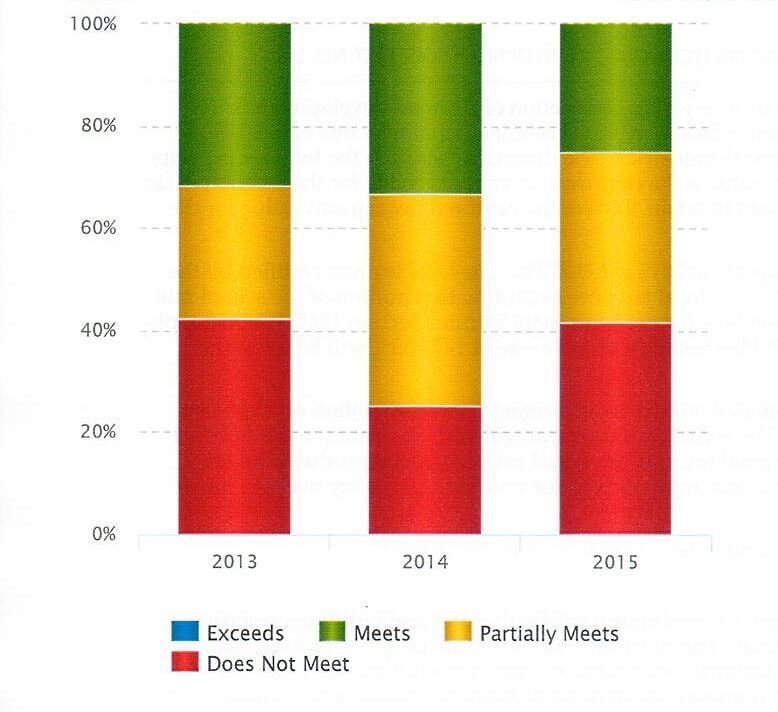
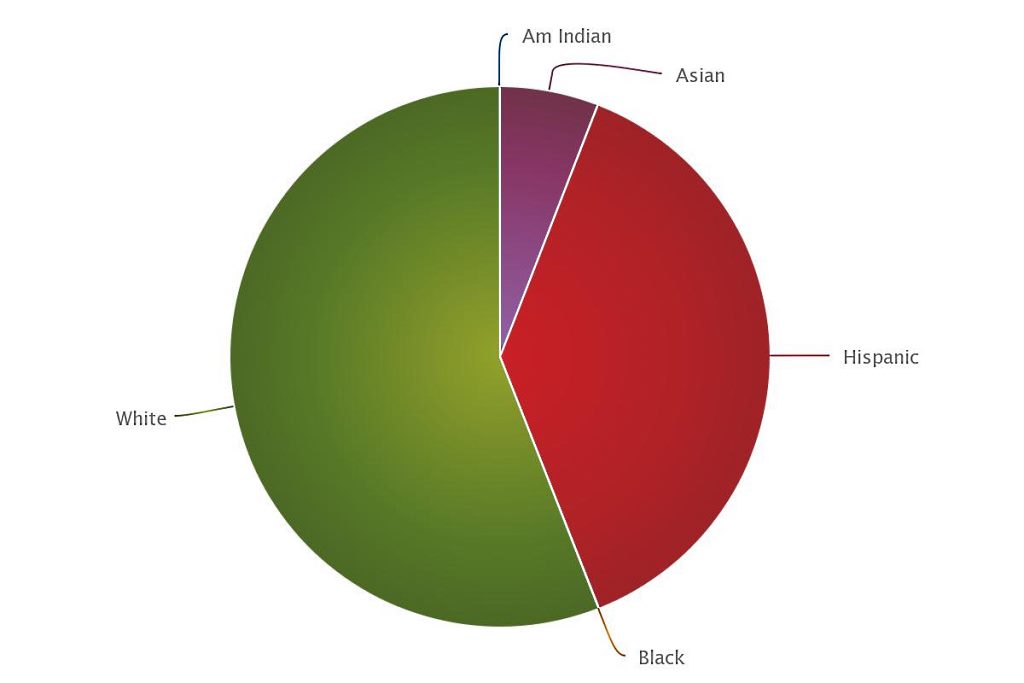
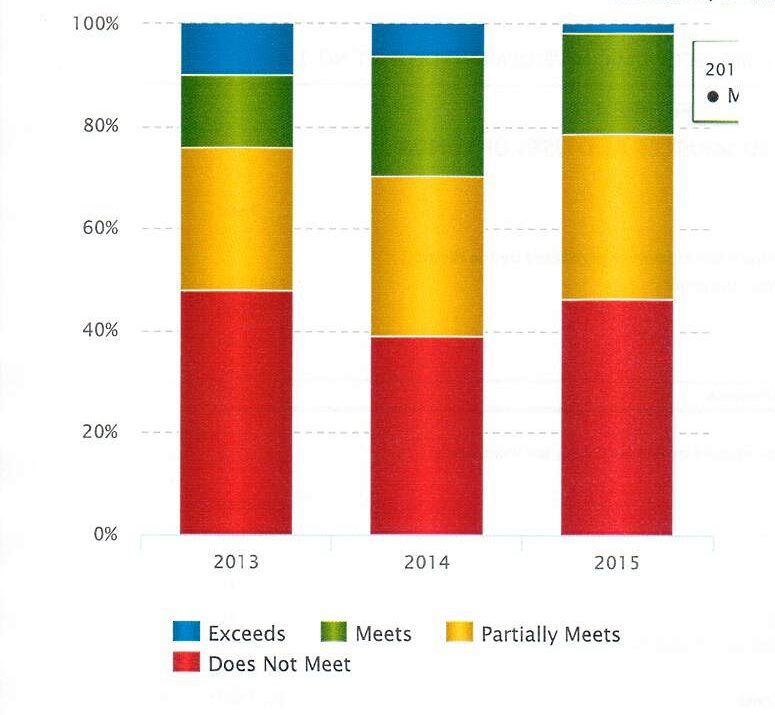
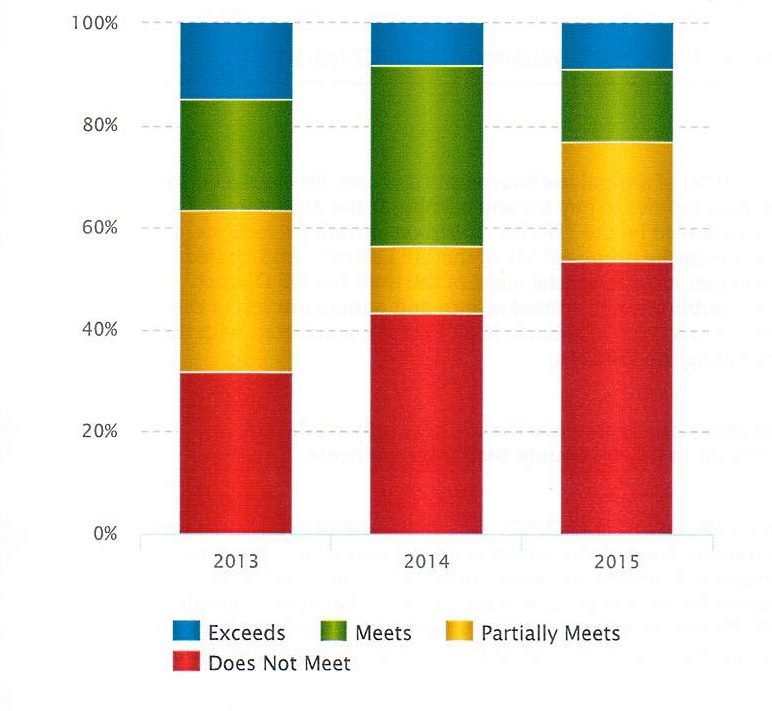
Below is a look at the demographics of Mountain Lake Public Elementary School, Mountain Lake Public High School, Butterfield-Odin Public Elementary School and Butterfield-Odin Public High School – along with a the Academic Standards achievement Exceeds, Meets, Partially Meets and Does Not Meet) for 2015, as well as a quick glance at the results from the previous two years:
Mountain Lake Public Elementary School Demographics
Mountain Lake Public Elementary School Math
Mountain Lake Public Elementary School Reading
Mountain Lake Public Elementary School Science (Grade 5)
Mountain Lake Public High School Demographics
Mountain Lake Public High School Math
Mountain Lake Public High School Reading
Mountain Lake Public High School Science
Butterfield-Odin Public Elementary School Demographics
Butterfield-Odin Public Elementary School Math
Butterfield-Odin Public Elementary School Reading
Butterfield-Odin Public Elementary School Science
Butterfield-Odin Public High School Demographics
Butterfield-Odin Public High School Math
Butterfield-Odin Public High School Reading
Butterfield-Odin Public High School Science